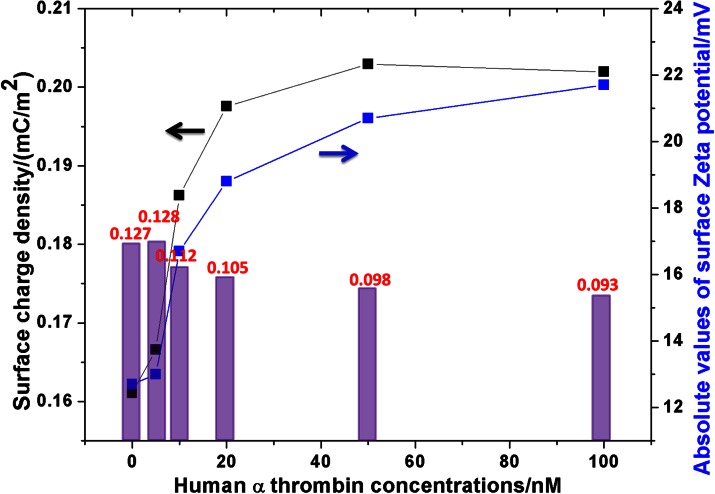
Figure 7.
Variation of the measured surface Zeta potentials (absolute values, all measured Zeta potentials were negative) and the calculated surface charge densities with the thrombin concentration. The columns (data on top) represented the ratios of the calculated surface charge density to the measured Zeta potential in each case, which theoretically should be the same.

