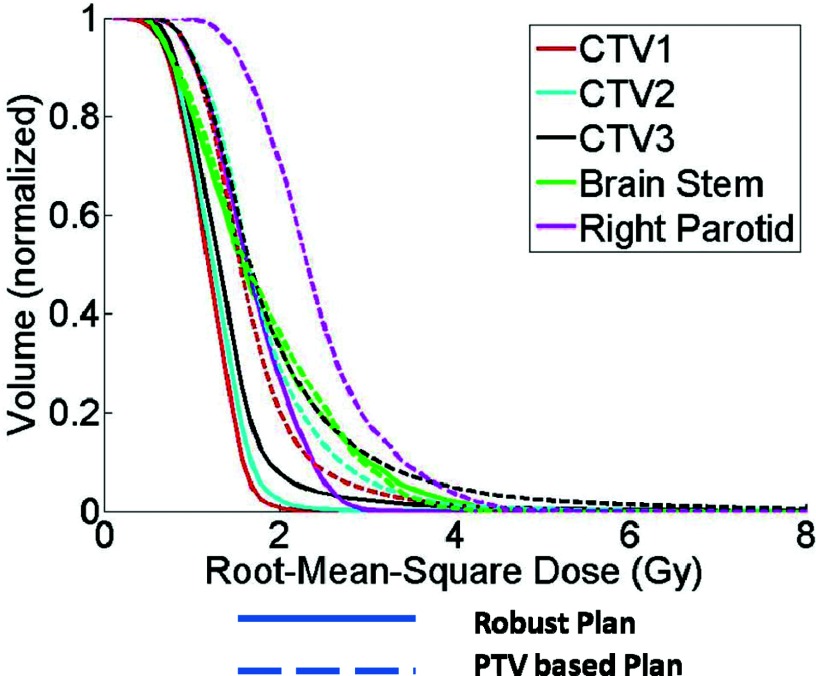
Figure 2.
RVHs derived from a robustly optimized plan (solid lines) and from a PTV-based optimized plan (dashed lines) for patient 10. All curves are normalized to the total volume of the corresponding organs. Areas under the RVH curves of the robustly optimized plan are smaller than those of the PTV-based optimized plan. The solid lines are for CTV1, CTV2, CTV3, Brain Stem, and Right Parotid, respectively from left to right.

