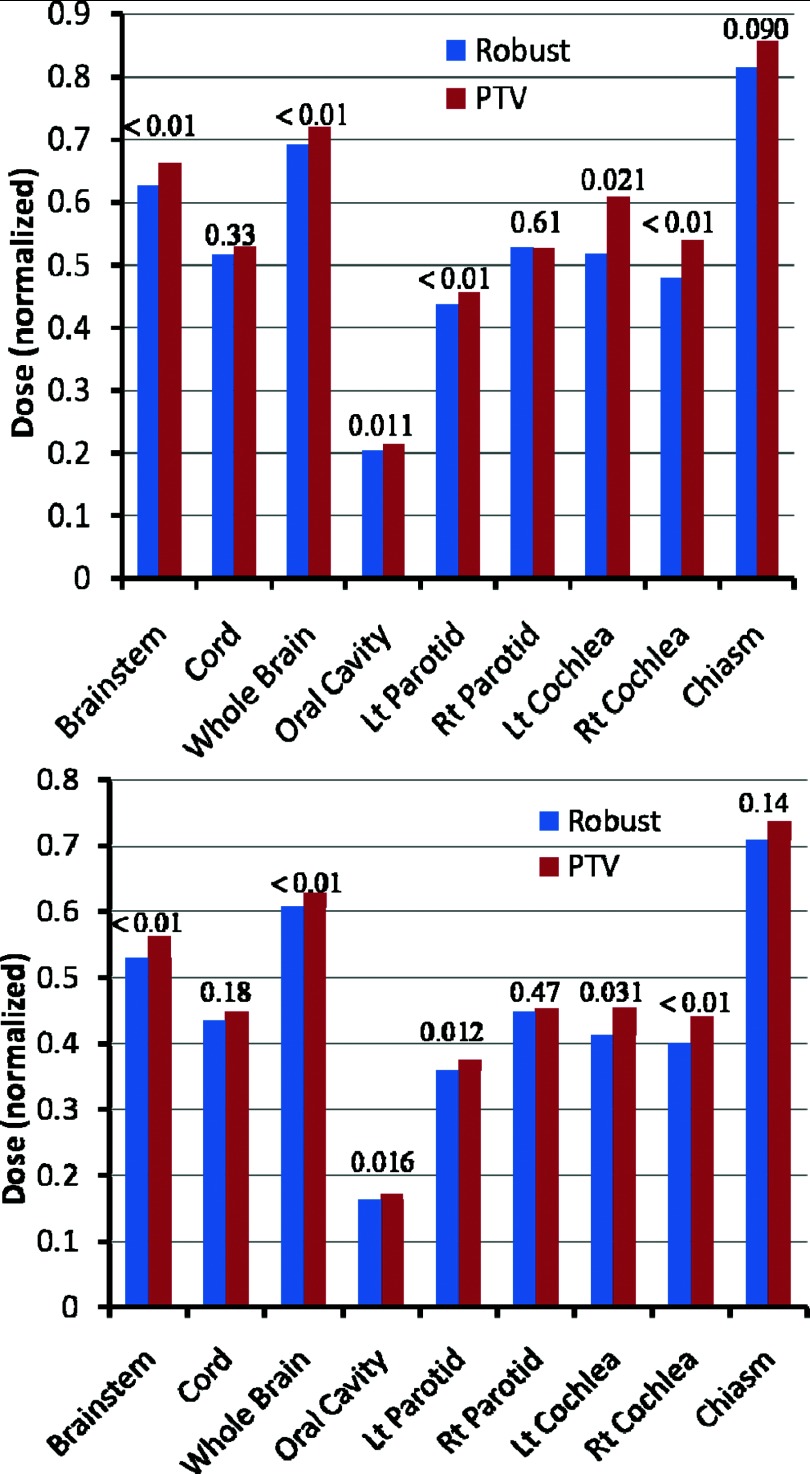
Figure 5.
Sparing of OARs in the worst-case scenario (top) and in the nominal scenario (bottom) in the robustly optimized plans (left bar for each structure) and the PTV-based plans (right bar for each structure), averaged over 14 H&N cases. Doses shown are D1cm3 to the spinal cord and brainstem, Dmean to the oral cavity and parotids, and D1% for other organs. Numbers at the top of the columns are P values. Data indicate improved sparing with robust optimization. The values of each case are normalized to the corresponding prescription doses before averaging [see Table I of the supplementary material (Ref. 27)].

