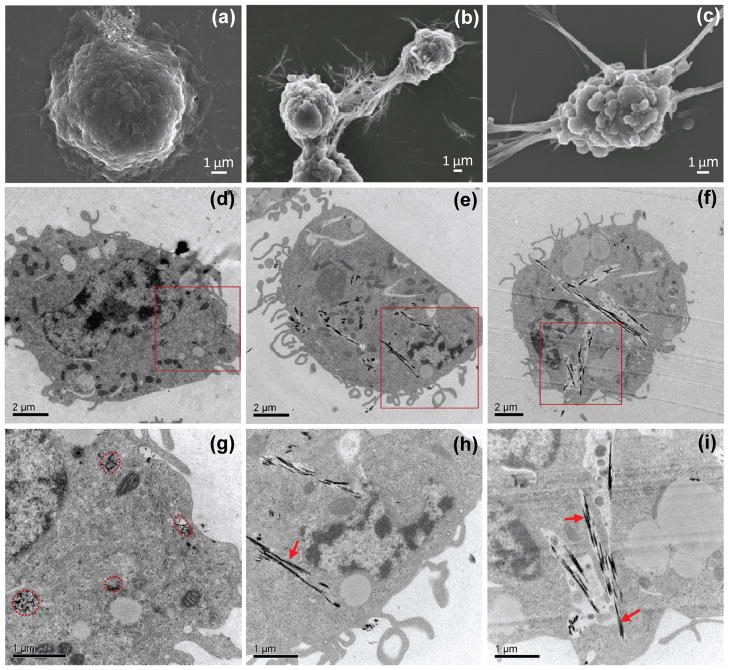
Figure 6.
Ultrastructural analysis to elucidate the interaction of CeO2 nanorods/nanowires with THP-1 cells using (a–c) SEM and (d–i) TEM. THP-1 cells were exposed to CeO2 nanorods/nanowires for 24 h at 50 μg mL−1: S2 (a, d, g); S6 (b, e, h), and S7 (c, f, i). Figure g, h, and i shows a higher magnification view of the labeled square area in Figure d, e, and f, respectively. The circles in Figure g highlight the S2 nanorods taken up into membrane–lined subcelluar compartments as indicated by in (h) and (i). The arrows indicate the “free-floating” nanorod bundles (S6 and S7) in the cytoplasm.

