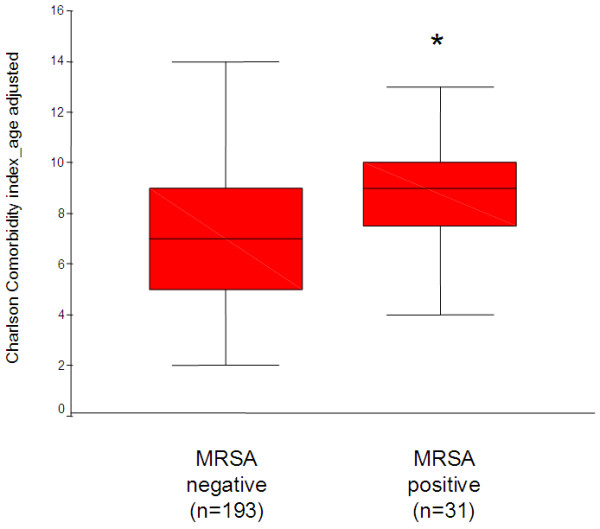
Figure 2.

Charlson Comorbidity index in nasal MRSA carriers and noncarriers. The age adjusted Charlson Comorbidity index showed significant differences between 31 nasal MRSA carriers and 193 noncarriers, where sufficient clinical data were available for analysis. Box-and-whisker plots indicating the median of the data set (middle line), the lower and upper quartiles (bottom and top of the box), and the range of values (whiskers) are showed.
