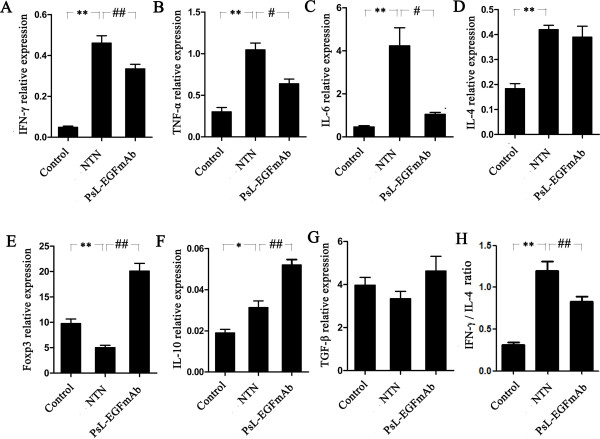
Figure 3.
The mRNA expression of cytokines in renal tissues. Real-time PCR for IFN-γ (A), TNF-α (B), IL-6 (C), IL-4 (D), Foxp3 (E), IL-10 (F), TGF-β (G) mRNA expression and IFN-γ/ IL-4 ratio (H) in renal tissues. Expression of the genes of interest was normalized to that of the GAPDH gene, and described as 2–ΔΔCt. The mean ± SD of four independent experiments is shown. *p < 0.05, **p < 0.01 vs. control; #p < 0.05, ##p < 0.01 vs. NTN group.

