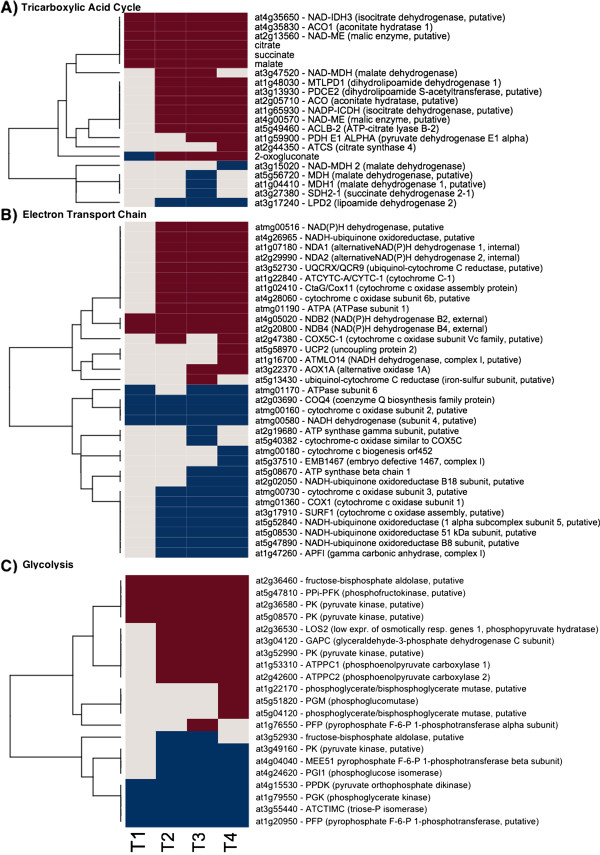
Figure 3.
Tricarboxylic Acid Cycle, ETC., and Glycolysis Gene Expression and Metabolite Changes. The gene expression levels across the rows are hierarchically clustered. Magenta cells represent significant positive expression changes, blue cells represent significant negative changes, and off white cells represent no change or no statistically significant change. The level of significance used was at P ≤ 0.05. The figure is divided into panels: A, transcripts associated with the Tricarboxylic Acid Cycle, B, ETC. transcripts, and C, glycolysis related transcripts.

