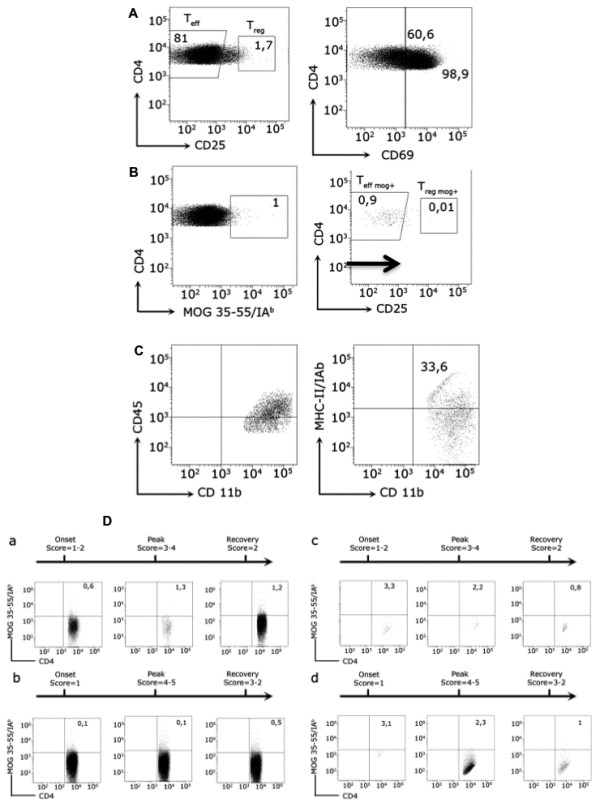
Figure 1.

MOG-specific T cells and microglia subpopulations analyzed by flow cytometry in mice with EAE. Leukocytes were obtained from the spleen and the CNS from MOG35-55 immunized C57BL/6 mice at different stages of EAE as indicated. A) Teff and Treg lymphocytes are shown. Numbers indicate the percentage of cells within the CD4+ cell gate. The histogram on the right shows the expression of CD69 on the surface of Teff and Treg cell subsets in the spleen. Numbers indicate the percentage of CD69+ cells. B) CD4+ cells stained with MOG35-55/IAb tetramer. MOG-specific Teff and Treg cells are shown. C) Dot-plots showing CD45+CD11b+MCH-II(IAb)+ microglia population. D) Antigen-specific Teff and Treg oscillate over the course of EAE. Numbers indicate the percentage within the CD4+ cell gate. MOG-specific T cells from spleen (a, b) and CNS (c, d) in the onset, peak and recovery stages of EAE are shown. Animals were not treated (a, c) or treated with anti-CD20 antibody before immunization (b, d).
