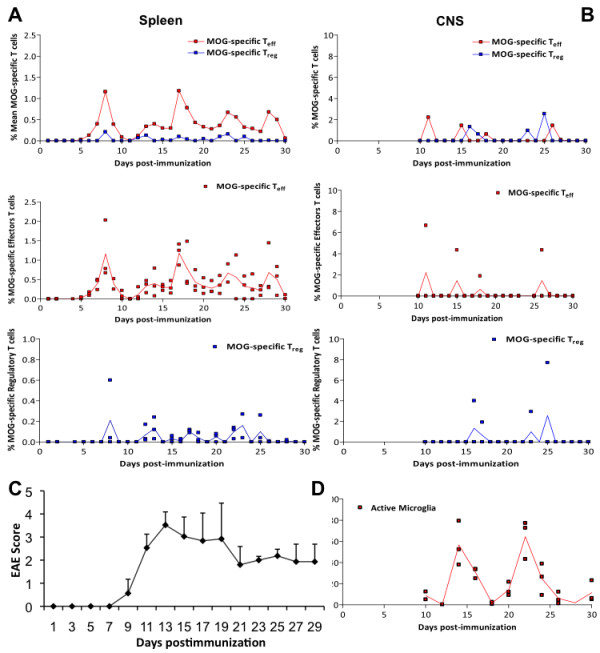
Figure 2.

Dynamics of activated MOG-Teff, MOG-Treg cells and microglia in secondary lymphoid organs and CNS during the course of EAE. A) Percentage of MOG-specific Teff (red) or Treg (blue) in the spleen after immunization. The upper graph shows the mean of the measurements from 3 animals each day for both populations (Teff and Treg) together. The bottom panels show the distribution of all measurements (raw data) from 3 animals per day for each subpopulation as dots, with the mean in black; B) percentage of MOG-specific Teff (red) or Treg (blue) in the CNS from day 9 after immunization. The upper graph shows the mean of the measurements from 3 animals each day, while the bottom panels show the distribution of all measurements for each subpopulation as dots, with the mean in black; C) Clinical score of animals suffering EAE after immunization (mean + SD); D) Percentage of activated microglia in the CNS from day 9 after immunization.
