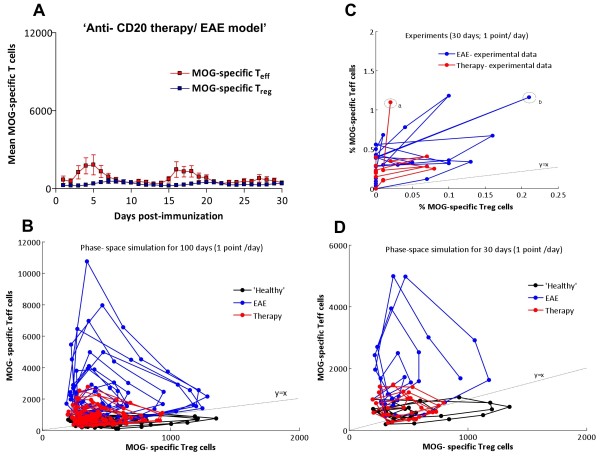
Figure 6.
Modeling the effect of anti-CD20 mediate B-cell depletion in the cross-regulation T-cell model. A) Simulation of the time course of the number of MOG -specific Teff (red) and Treg (blue) cells in the spleen (y-axis) after immunization (x-axis, in days) by the cross-regulation model using values for αreg and Keff from the ‘EAE’ regime (see Results section). B) Phase-space plots showing Teff/Treg cell counts trajectories in simulations of 100 (B) and 30 (D) days for ‘healthy’ (black), EAE (blue) and B-cell depletion (red) simulations. The 30-day simulation (D) was performed in order to compare with experimental data in C (in C, points ‘a’ and ‘b’ are marked as first peaks recorded in experiments for both groups compared). Simulations were discretized in days to show data points similar to experimental data in Figure 5A.

