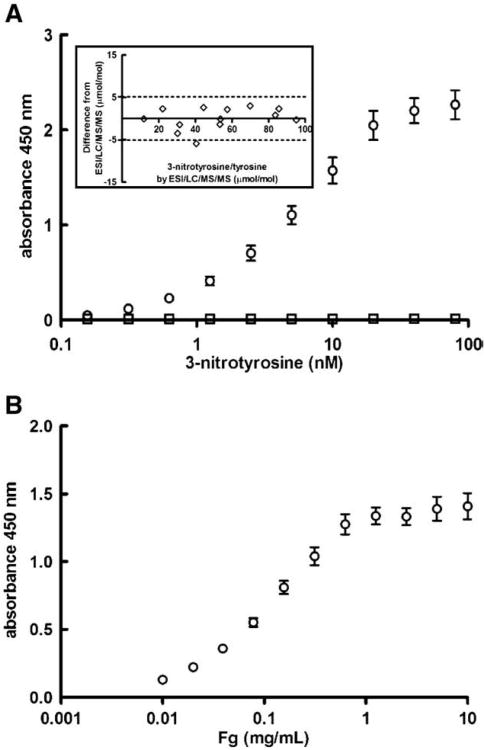
Fig. 1.
Fibrinogen nitration quantification by ELISA. (A) Plates were coated with polyclonal anti-nitrotyrosine antibodies and bound fibrinogen was detected with a polyclonal anti-human fibrinogen antibody that recognizes all chains of fibrinogen. The average ± SEM of 10 standard curves in the absence (○) and presence (□) of the 3-nitrotyrosine peptide used to raise the anti-nitrotyrosine antibodies is shown. Inset: The assay was validated by comparing the 3-nitrotyrosine/tyrosine ratio acquired with the ELISA with the ratio acquired by the established LC/ESI/MS/MS analysis in affinity-purified fibrinogen of the same individuals. The insert illustrates the results of Bland-Altman analysis described in the text. (B) To quantify plasma fibrinogen levels, plates were coated with a monoclonal fibrinogen antibody that recognizes the α-chain of native, oxidized, and nitrated human fibrinogen and bound fibrinogen was detected with the same antibody as in panel A. The average ± SEM of 10 standard curves is presented.

