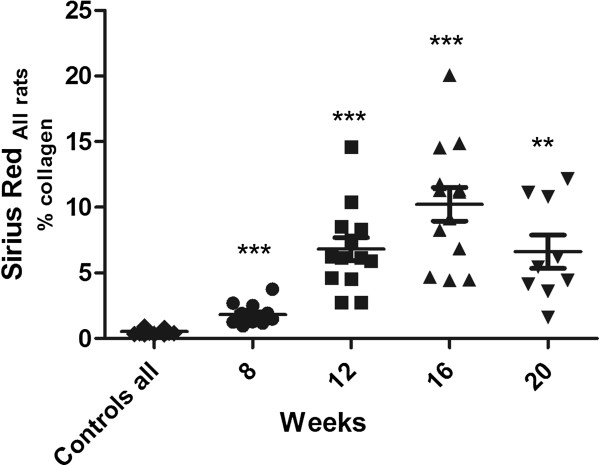
Figure 5.
Absolute values of Sirius red quantification, indicated as % collagen in CCL4-treated rats determined at 8, 12, 16, and 20 weeks of treatment. (CCL4-treated animals: n = 13; controls: n = 7 for each group). The bars indicate mean ± standard error of the mean (SEM) (** P < 0.01, *** P < 0.001).

