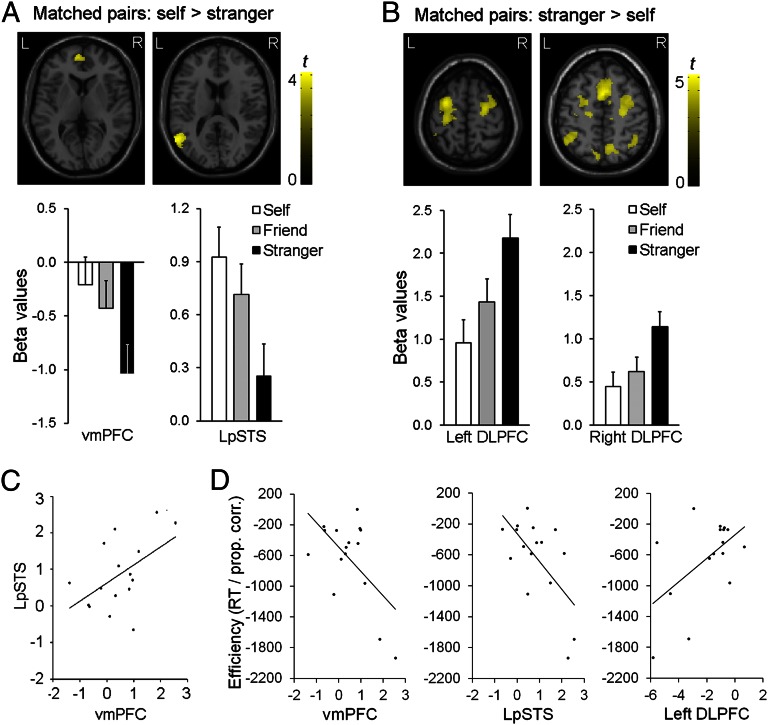
Fig. 2.
Functional magnetic resonance imaging (fMRI) data for shape-label–matched association at P < 0.005 with an extent threshold of >70 voxels. (A) Self > stranger in the vmPFC and LpSTS, and beta values of brain responses in the vmPFC and LpSTS. Error bars represent one SE. (B) Stranger > self in the dorsal attentional network, and beta values of brain responses in the bilateral DLPFC. Error bars represent one SE. (C) Correlations between beta values of the vmPFC and LpSTS for self > stranger comparison. (D) Correlations between responses efficiency (RT/proportion correct) and beta values extracted from the vmPFC, LpSTS, and DLPFC using self-stranger differences from matching trials.

