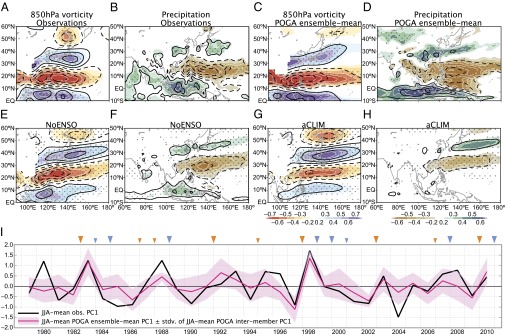
Fig. 2.

(A–H) Anomalies of (A, C, E, and G) 850-hPa vorticity and (B, D, F, and H) precipitation associated with EOF1s of NWP 850-hPa vorticity. Shown are (A and B) observations, (C and D) POGA ensemble mean, (E and F) NoENSO, and (G and H) aCLIM. Shading indicates correlations, with stippling representing 95% statistical confidence, whereas contours show regressed anomalies, all with respect to PC1s. Contours are plotted for (A, C, E, and G) ±0.5, ±1.5, ±2.5, … ×10−6 s–1 and (B, D, F, and H) ±0.5, ±1.5, ±2.5, … mm⋅d–1. (I) The corresponding PC1 time series in observations (black) and POGA (red), averaged for JJA. Shading represents ±1 SD of intermember PC1 in POGA. Orange and blue triangles at the top indicate El Niño and La Niña events (large triangles, strong to moderate; small triangles, weak), respectively, based on NDJ Niño 3.4 SST.
