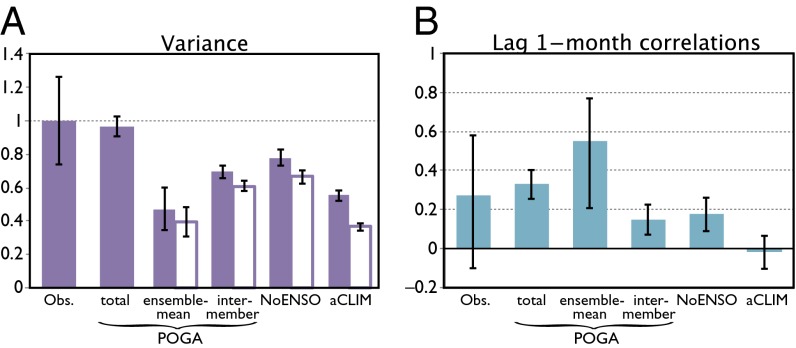
Fig. 3.
(A) Variance explained by (solid bars) EOF1 of individual variability and (open bars) projections onto the EOF1 pattern of POGA total variability, both scaled with variance of observational EOF1 (Materials and Methods). (B) One-month–lagged autocorrelations of PC1s. Error bars (A) are derived from North’s rule and (B) represent 95% intervals.

