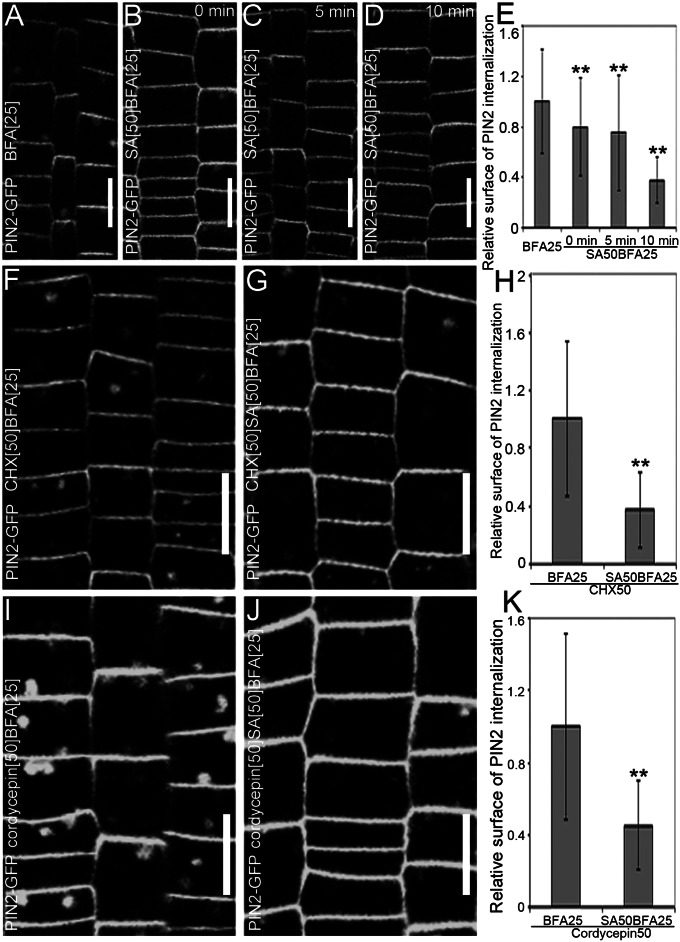
Fig. 4.
Transcription- and protein synthesis-independent effect of SA on endocytosis. (A–E) Evaluation of the effect of pretreatment with SA on the BFA-induced internalization of PIN2-GFP. (A) PIN2-GFP internalization treated with 25 µM BFA for 90 min (n = 248 BFA bodies; 18 roots). (B–D) Effect of cotreatment of 25 µM BFA and 50 µM SA after pretreatment with 50 µM SA for 0 min (n = 114 BFA bodies; 20 roots) (B), 5 min (n = 85 BFA bodies; 27 roots) (C), or 10 min (n = 64 BFA bodies; 18 roots) (D). (E) Quantitative evaluation of the effect of the SA pretreatment on the BFA-visualized PIN2-GFP internalization. (F and G) BFA-visualized internalization of PIN2-GFP in the presence of 50 μM CHX (n = 249 BFA bodies; 16 roots) (F) or cotreated with 50 μM SA for 90 min after a 30-min pretreatment with 50 µM SA (n = 241 BFA bodies; 24 roots) (G). (H) Quantification of the SA effect on the BFA-induced PIN2-GFP internalization in the presence of CHX. (I and J) BFA-visualized internalization of PIN2-GFP in the presence of 50 μM cordycepin (n = 303 BFA bodies; 13 roots) (I) or cotreated with 50 μM SA for 90 min after a 30-min pretreatment with 50 µM SA (n = 227 BFA bodies; 23 roots) (J). (K) Quantification of the SA effect on the BFA-induced PIN2-GFP internalization in the presence of cordycepin. Values in E, H, and K represent the mean surface area relative to the corresponding control treatment. Data are means ± SD; **P < 0.01 (Student’s t test). (Scale bars: 10 μm).

