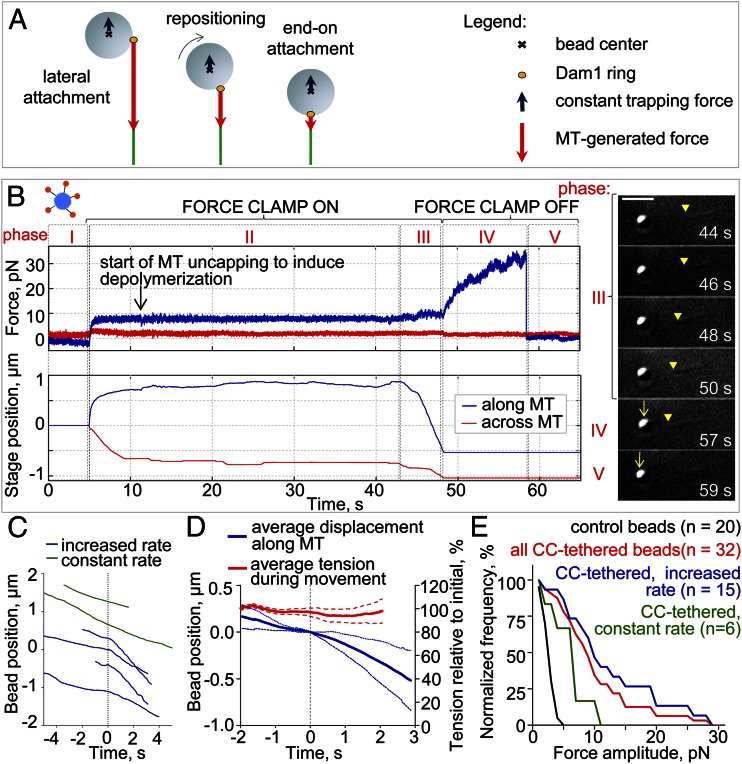
Fig. 4.
Lateral to axial repositioning of the beads. (A) Illustration of a bead repositioning under the two oppositely directed forces that come from the depolymerizing MT and the trap. The force vectors are initially displaced but become aligned after the bead repositions. (B) Force and stage positions vs. time illustrate five experimental phases in one representative experiment. Phase I, laterally attached motionless bead. Phase II, bead is clamped and pulled to the MT plus end. After the stage settles and the clamp force is maintained constant, we trigger MT depolymerization. Phase III, the end of a shortening MT reaches the bead, and the stage moves to maintain constant force (in Right, the yellow arrowheads point to the MT minus end, and the arrows point to a bead moving in a stationary trap). (Scale bar: 3 μm.) Phase IV, we stop the stage and record the bead’s continued motion in the now stationary trap. Phase V, bead detaches from the MT tip and falls back to the trap’s center. (C) Example tracks of motions for CC-tethered beads (phase III). Tracks with increase in the speed are aligned to the center in the time that this change took place (time 0 for blue curves). (D) Average of centered two-phasic traces of the CC-tethered beads tracking the shortening MT end under an approximately constant trapping force of 2.6 ± 0.5 pN (right axis); dotted lines are SDs. (E) The percent of force signals measured in phase IV with amplitude that exceeded the value specified, normalized for different groups of beads. The CC-tethered beads that increased their speed during phase III (blue) showed larger force transients, on average, than the control beads (black, P < 0.05) or the CC-tethered beads that did not change their speed (green, P < 0.07). The maximum forces measured increased 5.8 and 2.6 times, respectively.

