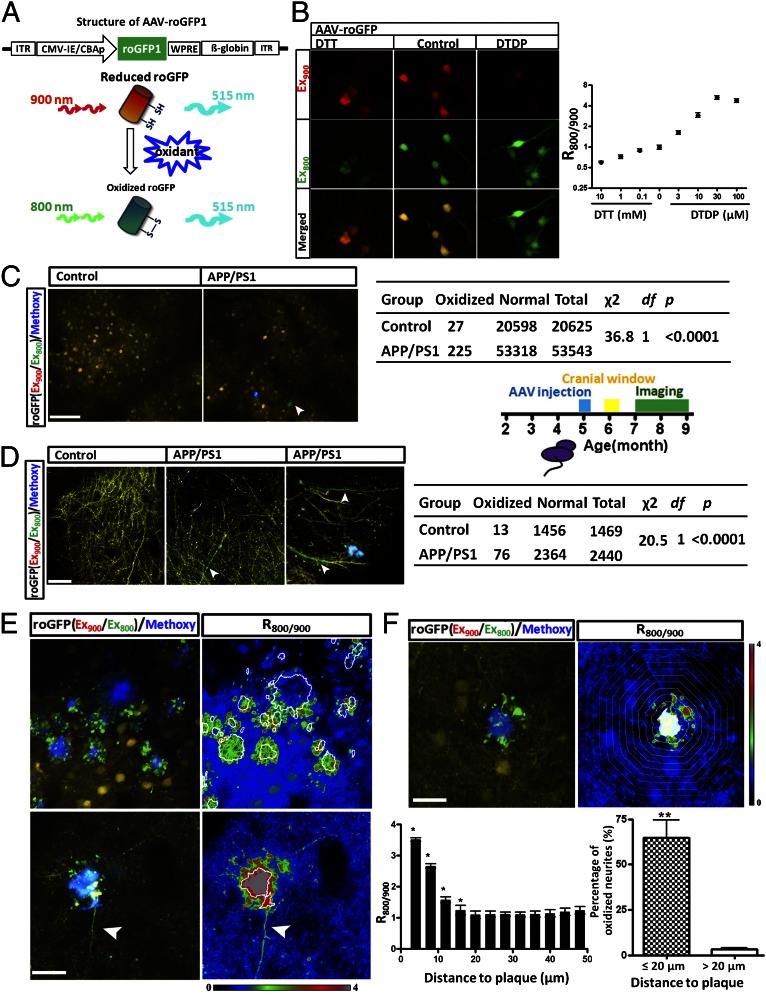
Fig. 1.
In vivo imaging of cellular oxidative stress with roGFP in APP/PS1 mice and control littermates. (A) Schematic depicting the construct of AAV-roGFP and imaging of reduced or oxidized roGFP by multiphoton excitation. The ratio of the emission fluorescence excited at 800 nm and 900 nm was used as an index of the redox status of roGFP. (B) Redox sensitivity of roGFP in primary neurons. DTT decreased the roGFP ratio (R800/900), whereas DTDP increased the ratio (n ≥ 246 neurons). (C) Oxidative stress in neuronal soma in APP/PS1 transgenic mice and control wild-type mice. χ2 test showed significant increased oxidative stress in APP/PA1 mice than in control group (n = 20,625 neurons from eight control mice and n = 53,543 neurons from 13 APP/PS1 mice). Arrowhead shows an oxidized neuron. (D) Increased oxidative stress in neurites in APP/PS1 transgenic mice compared with control wild-type mice (n = 1,469 neurites from six control mice and n = 2,440 neurites from eight APP/PS1 mice). roGFP signals were measured in the areas distant (>20 µm) to Aβ plaques in APP/PS1 transgenic mice. Arrowheads showing oxidized neurites. (E) Images of oxidized neurites surrounding Aβ plaques. (E, Left) Multiphoton images of plaques surrounding areas. (E, Right) Heat-map image of the roGFP ratio surrounding plaques, based on Left. The arrowhead in Lower indicates the propagation (∼100 µm) of oxidative stress in a neurite. (F) Spatial impact of Aβ plaques on surrounding neurites. (F, Upper) An Aβ plaque results in an increased roGFP ratio in the surrounding area. Each band represents a 4-µm concentric area from the plaque edge. (F, Lower Left) Quantitative analysis of roGFP ratio versus the distance to plaques (n = 12 plaques from three mice). (F, Lower Right) Remarkable increase of oxidative stress in neurites closed (≤20 µm) to Aβ plaques. (Scale bars: B and F, 20 µm; C, 100 µm; D, 30 µm; E, 40 µm.)

