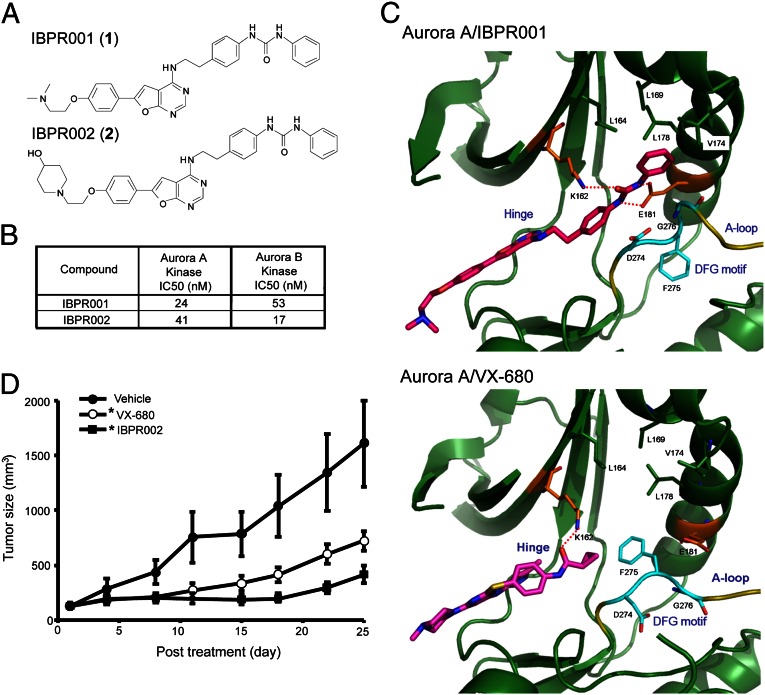
Fig. 1.
Structures of IBPR compounds that induce a change in DFG conformation in Aurora A. (A) Chemical structures of IBPR001 (1) and IBPR002 (2). (B) IC50 of the compounds from the in vitro Aurora A and Aurora B activity assay. (C) Active sites of Aurora A in complex with IBPR001 and VX-680. The interacting residues with the inhibitors are shown in stick representation and are labeled. The DFG motif (cyan) at the activation loop (A-loop, yellow) adopts a different conformation to accommodate IBPR001 from VX-680. Hydrogen bonds between the inhibitors and Aurora A are shown as red dashed lines. For figure presentation clarity, hydrogen bonds between the inhibitors and the hinge region are omitted. (D) Athymic nude mice xenograft with HCT116 cancer cells were injected i.v. with control vehicle or 50 mg/kg of VX-680 or IBPR002. Mean tumor volumes (in cubic millimeters) ± SEM (n = 10 per group) are shown from the initiation of treatment (∼100 mm3). *P < 0.05 compared with vehicle.

