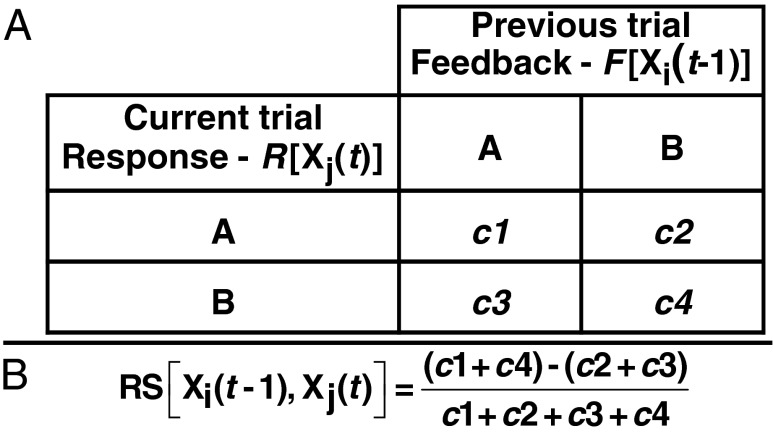
Fig. 7.
(A) Description of trial types used in the recency analysis computations: c1 and c4 represent the number of trials for which the participant’s response matches the feedback from the previous trial, and c2 and c3 represent the number of trials for which the participant’s response does not match the feedback from the previous trial. (B) Equation describing how to calculate a recency score (RS).

