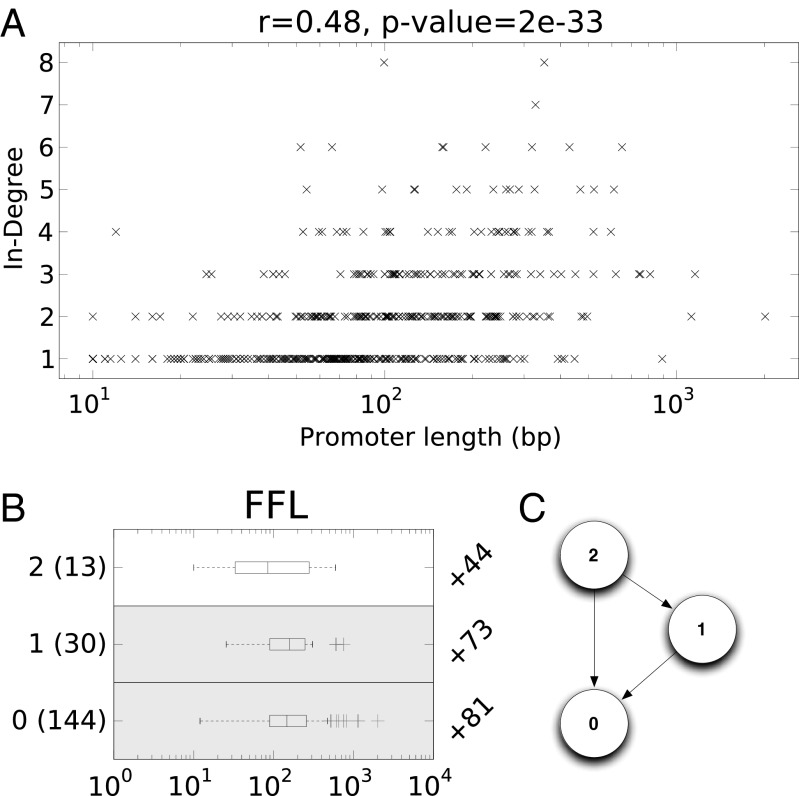
Fig. 1.
Significant promoter length signal exists in the E. coli regulatory network on both the system and the subsystem levels. (A) Each operon is plotted with its in-degree and promoter length; we report the Pearson correlation coefficient and significance above the plot. (B) The distributions of promoter lengths for operons that participate in feed-forward loops (FFL) are presented as boxplots per node. The left axis provides the node label, which corresponds to the node in the subgraph diagram C (e.g., 0 or 1), along with the number of distinct operons represented in that distribution. The difference in the average promoter length in the node distribution minus the average promoter length in the network is listed on the right axis in B. Distributions with significant uplift, assessed using a nonparametric Wilcoxon rank-sums test, are indicated with a gray background behind the boxplot (P values for  and for
  ).
).

