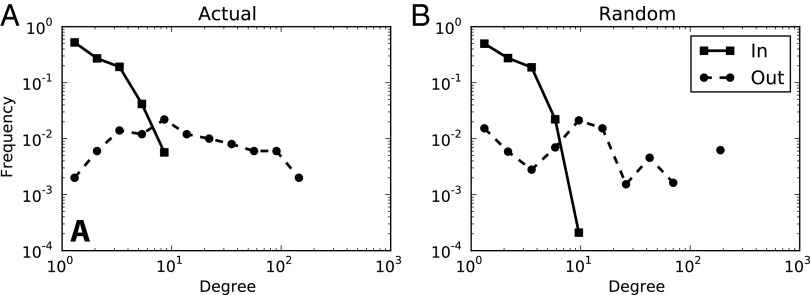
Fig. 2.
(A and B) In-degree and out-degree distributions for the actual E. coli network (A) and the random networks (B) are compared side by side. Scatter points indicate the 12 logarithmic bins used to plot the lines. The discontinuity in the out-degree line in the random plot indicates that there are no nodes in the bin with a degree of around 100. We used a two-sample Kolmogorov–Smirnov test and found that all degree distributions did not differ significantly between the actual and the random distributions.

