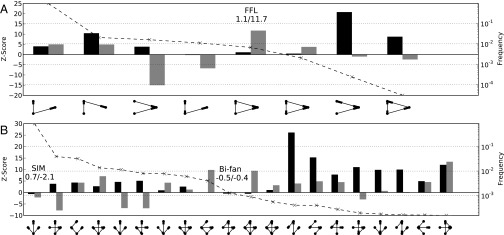
Fig. 3.

(A and B) z-scores for three- (A) and four (B)-node subgraphs are ranked according to frequency in the E. coli network. The left axis provides the scale for the z-score (bars) and the right axis measures the frequency (dashed line) of each subgraph. For each subgraph, the z-scores for our model (black) and the edge-rewiring model (gray) are graphed side-by-side. Both models used 1,000 random networks to calculate significance. Important motifs are annotated along with the precise z-score found by each model (left, our model; right, edge switching). Only the top 20 most frequent four-node subgraphs are shown.
