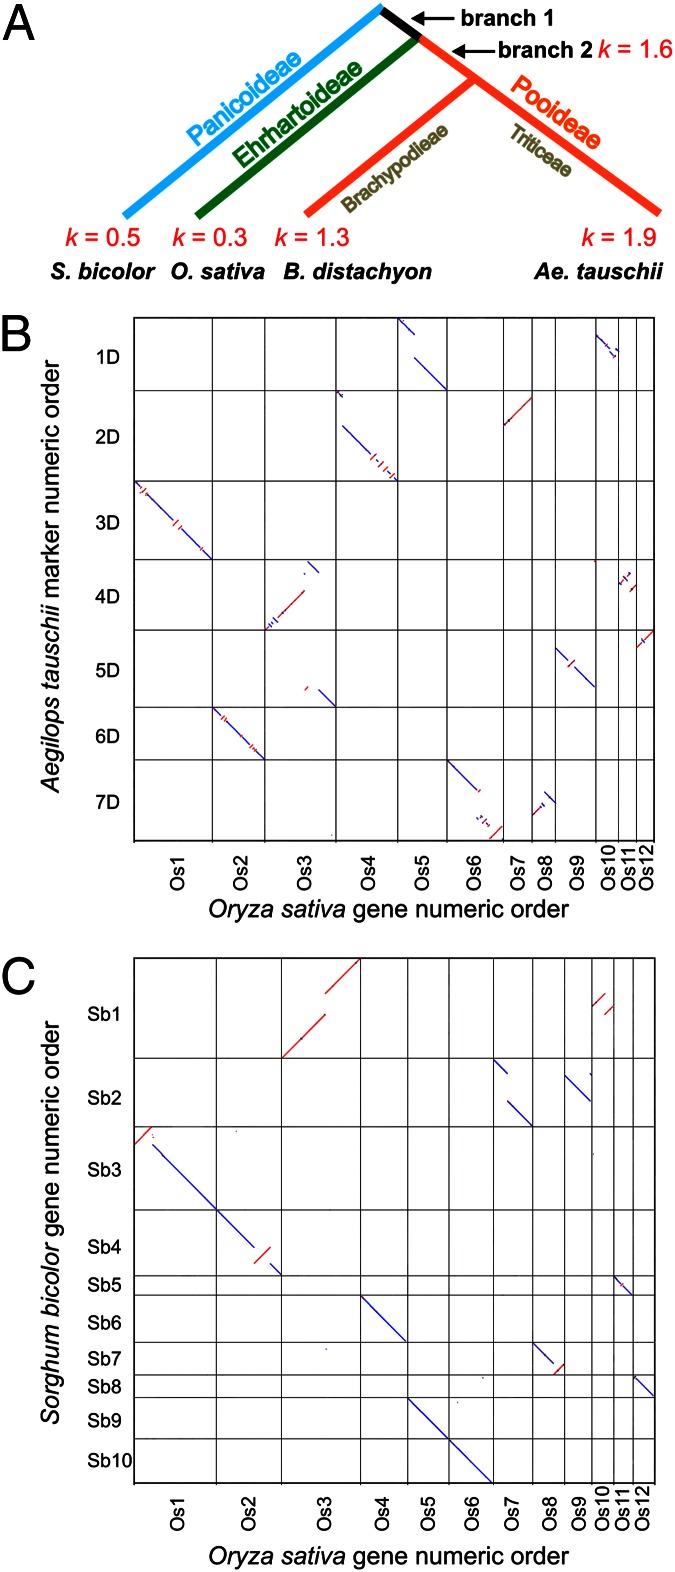
Fig. 2.
Rates of structural genome evolution in the grass family. (A) Rates (k; numbers of inversions, translocations and NCIs per million years) during the evolution of grass subfamilies Panicoideae, Ehrhartoideae, and Pooideae. (B and C) Pairwise dot-plot comparisons of gene order along Ae. tauschii physical maps (B) and along sorghum pseudomolecules (C) relative to that along the rice pseudomolecules. Chromosomes and pseudomolecules on the y axis have the tips of the short arms at 0 Mb, respectively, at the top. Blue dots indicate parallel order and red dots indicate antiparallel order of chromosomes and pseudomolecules on the x and y axes. Only orthologous loci are shown for the sake of clarity.

