
Fig. 2.
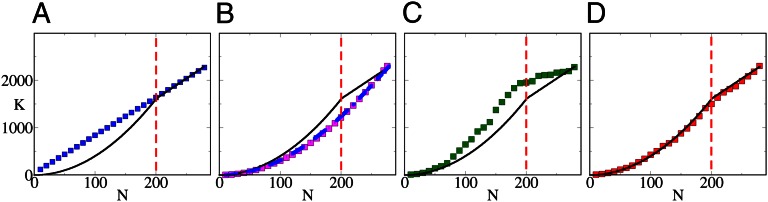
Modeling network growth. (A) The linear preferential attachment model (BA, blue ■) fails to reproduce the biphasic growth observed (solid line). (B) In the BAG model (magenta ■) and the HAG model (dashed blue line), the average node degree increases linearly with the size of the network. (C) The ESG model (green ■) exhibits a biphasic behavior, yielding a transition from quadratic to nearly linear growth at  , but fails to capture the details of the observed growth. (D) The ESTG model (red ■) accurately reproduces the details of the biphasic growth trajectory; for example, the inflection point of the modeled developmental curve corresponds closely to the moment of metamorphosis (hatching). The red dashed line in each panel indicates the number of nodes at the time of hatching
  . The SE of each growth curve is smaller than the size of the symbols used to plot it and is not reported.