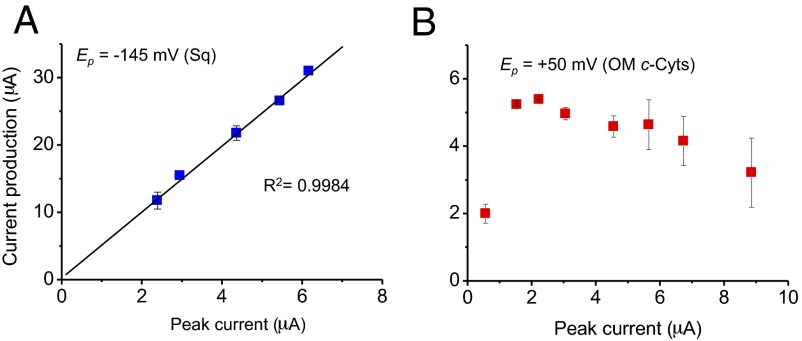
Fig. 5.
Contribution of the EET pathway associated with Sq formation in microbial current generation. Plot of bacterial current production at an electrode potential of +200 mV (vs. Ag/AgCl KCl saturated) against the peak current of (A) Sq (Ep = −145 mV) and that of (B) OM c-Cyt (Ep = +50 mV), as determined by DP voltammetry. The squares of the correlation coefficients were estimated by the addition of the point of origin to the obtained data. Error bars indicate the SEMs calculated with microbial current production data obtained before and after a DP voltammetry measurement.

