Fig. 6.
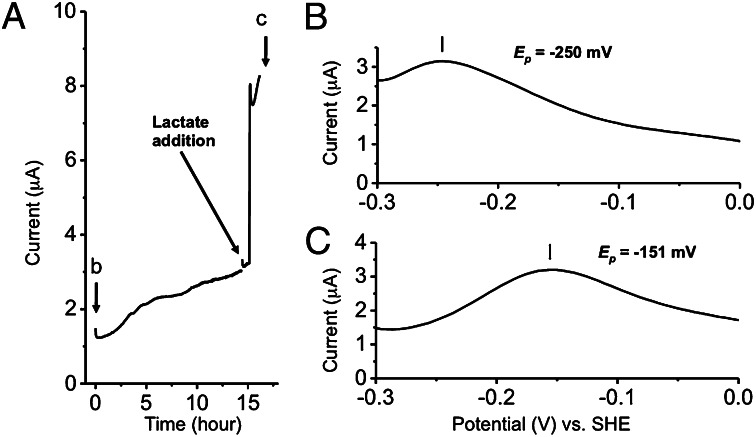
FMN/MtrC protein interaction couples with metabolic activity. (A) Current (I) vs. time measurements of microbial current generation for strain MR-1 cells on an ITO electrode surface at +200 mV (vs. Ag/AgCl KCl saturated). The arrow indicates the point at which 10 mM lactate was added into the reactor. DP voltammograms for monolayer biofilms of S. oneidensis MR-1 on an ITO electrode surface with the addition of 2.0 μM FMN, (B) before and (C) after the addition of lactate.

