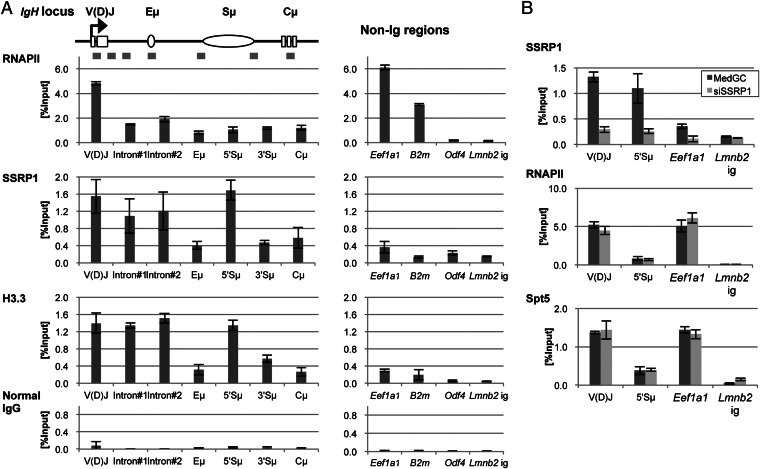
Fig. 3.
Enriched FACT occupancy in the SHM target regions of Igh with histone H3.3 in JP8Bdel-ER BL2 cells. (A) ChIP analysis for Igh and non-Ig regions by qPCR. Schematic of the positions of PCR amplicons on Igh used for the ChIP assay is shown at Top. The occupancies of RNAPII, SSRP1, H3.3, and normal IgG were calculated as % Input and are shown in graphs for each factor. Data are the mean and SD of three independent experiments. (B) ChIP analysis with SSRP1-knocked down cells. Forty-eight hours after the transfection of MedGC control or anti-SSRP1#1 stealth siRNA, the cells were subjected to a ChIP assay. The occupancies of SSRP1, RNAPII, and Spt5 on the indicated regions were then measured by qPCR. Data are the mean and SD of three independent experiments. The primers and antibodies used for the ChIP assay are shown in Tables S6 and S7, respectively.

