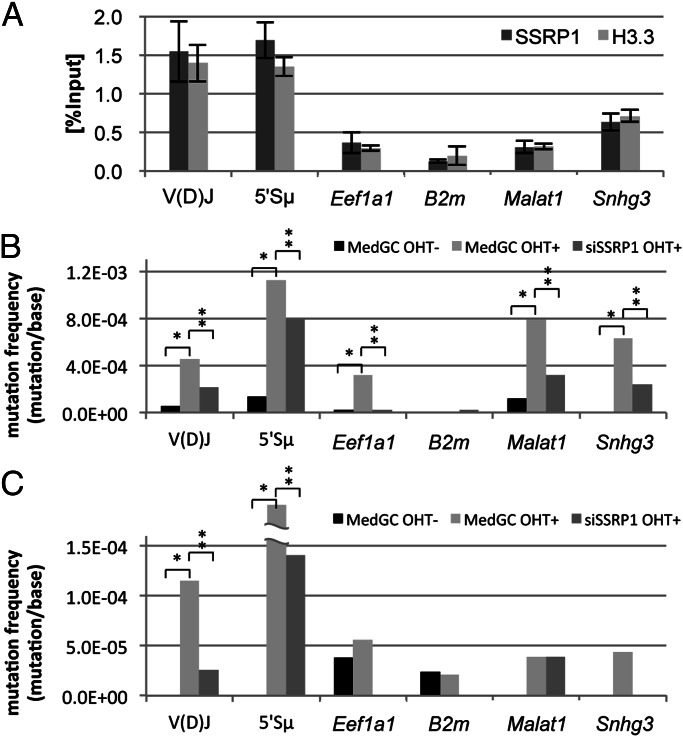
Fig. 5.
Comparison between the FACT occupancy level and mutation rate. (A) FACT and H3.3 occupancies in the indicated regions. Data except for the Malat1 and Snhg3 are the same as the data shown in Fig. 3A. Data are the mean and SD of three independent experiments. (B and C) Mutation frequencies of the indicated regions in JP8Bdel-ER (B) and AID-ER BL2 cells (C) with or without OHT treatment. Note that the data of the V(D)J mutations in B are the same as shown in Fig. 2A. The detailed information for the sequencing analysis is shown in Table S1. *P < 0.05 compared with MedGC OHT−; **P < 0.05 compared with MedGC OHT+ (Fisher’s exact test).

