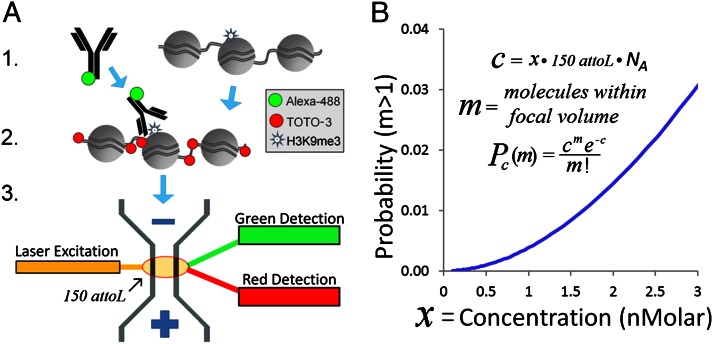
Fig. 1.
SCAN workflow. (A) Native chromatin bearing epigenetic marks is mixed with fluorophore (e.g., AlexaFluor488) labeled antibody specific to a given mark. After binding, the chromatin is labeled with an intercalator (e.g., TOTO-3). Finally, the chromatin is driven by voltage through a nanoscale channel fabricated in fused silica and fluorescent measurements of individual molecules are taken in a 150-aL inspection volume. A more detailed schematic of laser setup can be found in our previous publication (10). (B) Probability of erroneously interrogating more than a single molecule increases with analyte concentration according to a Poisson distribution less than 0.5% at the concentrations used here (≤1 nM). Pc(m), probability of m molecules residing in the 150-aL interrogation volume at any one time, given concentration c of fluorescent molecules in analyte, expressed as molecule count x in 150 aL, where NA is Avogadro’s number. The curve shows the probability that more than one molecule is in the inspection volume.

