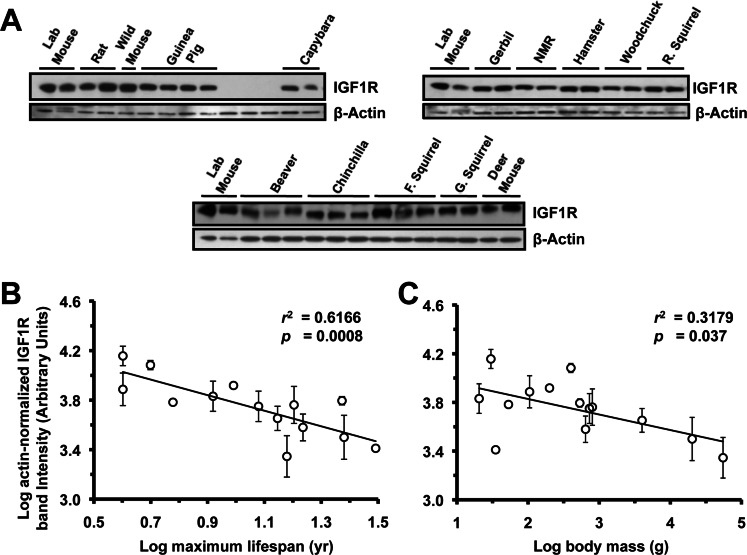
Figure 2.
Levels of IGF1R protein in brain tissue are highly negatively correlated to lifespan, and weakly negatively correlated to body mass. (A) Western blots showing IGF1R and actin bands. (B) Log-transformed graph of IGF1R intensity plotted against maximum lifespan shows strong correlation (r2=0.61, p=0.0008). (C) Log-transformed graph of IGF1R intensity plotted against average adult body mass show marginally significant correlation (r2=0.31, p=0.037). Error bars: 1 SD. Correlation of brain IGF1R to lifespan was still strong (r2 = 0.58, p = 0.0009) after multiple regression analysis factoring in the contribution of body mass to lifespan, whereas correlation between body mass and lifespan was non-significant (adjusted r2 = 0.14, p=0.1). Phylogenetic correction by independent contrasts maintained a significant correlation to lifespan (r2= 0.374, p= 0.0261) while the correlation to body mass was rendered non-significant (r2= 0.189, p= 0.136).

