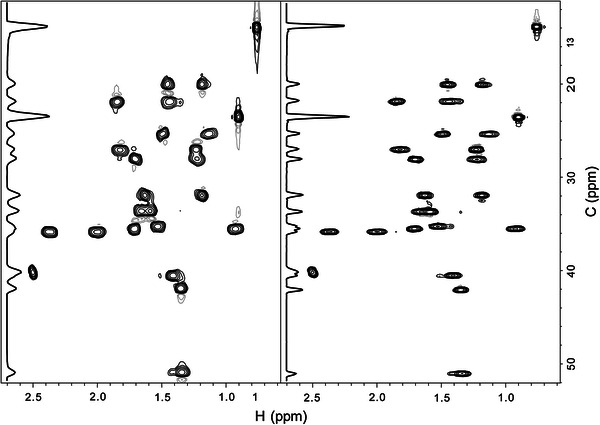
Fig. 3.

Improvements in 2D 1H- 13C HSQC spectral quality due to adaptive spectral-width. Black contours show positive spectral intensity, while grey contours show negative intensity. The 2D HSQC spectrum on the left was collected with general acquisition parameters (i.e. 13C-dimension SW parameter of 200 ppm). The spectrum on the right was collected using the same acquisition parameters, except for a 50 % reduction in spectral-width and a corresponding change in 13C-offset (dimension center) as determined by automated analysis of a 1D 13C spectrum acquired previously in the experiment set. The gains in 13C resolution and decoupling efficiency are highlighted by the trace along the left edge of each spectrum
