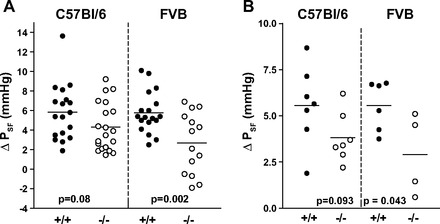
Fig. 3.

TGF responses in individual nephrons of WT (+/+) and Cx40-deficient mice (−/−) on C57BL/6 (left) and FVB (right) genetic backgrounds. A: TGF responses magnitude in individual nephrons; B: TGF response magnitude in individual mice (averages of 1–4 nephrons/mouse). Mean values are indicated by horizontal lines; a t-test was used for P values.
