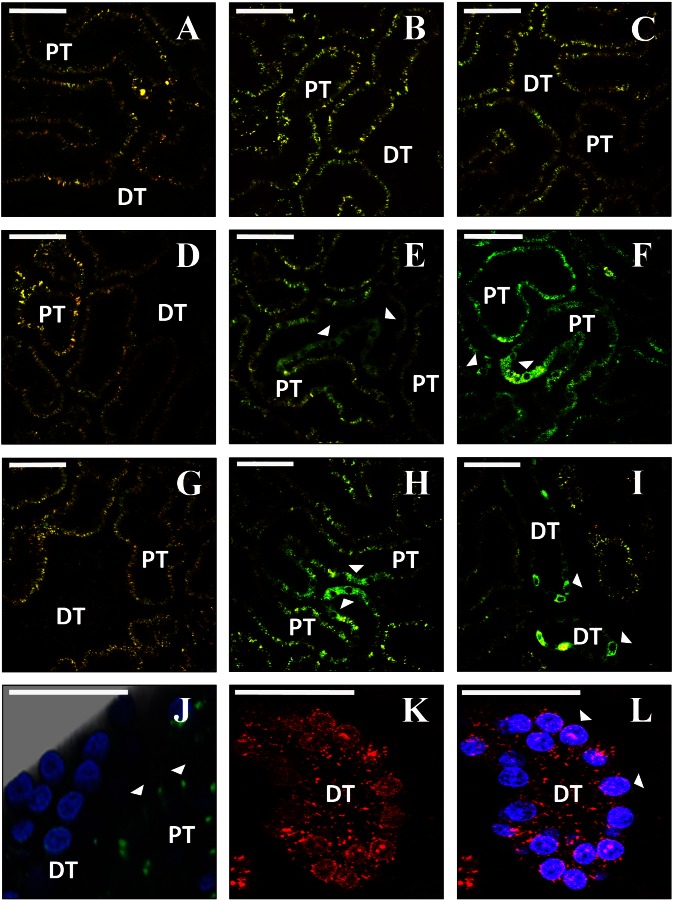
Fig. 2.
Intravital imaging shows expression of fluorescent proteins from plasmid vectors. A, D, and G: rat kidneys before hydrodynamic injection. Characteristic autofluorescence signal is detected in both the red and green channels. B, C, E, F, H, and I: 2 representative fields collected from the same animals as in A, D, or G using the same imaging parameters, 3 days after injection of saline (B and C), enhanced green fluorescent protein (EGFP) plasmid (E and F), or EGFP-tubulin plasmid (H and I). Arrowheads indicate tubular epithelial cells expressing the fluorescent proteins. J: 3-dimensional rendering of a volume collected from an animal 3 days after injection of EGFP-occludin plasmid (green). Nuclei are labeled with Hoechst (blue). K and L: rat kidney 1 day after injection of plasmid encoding tdTomato-histone H2B (red). Nuclei in L are labeled with Hoechst (blue). DT, distal tubule; PT, proximal tubule. Bars in all panels = 60 μm.

