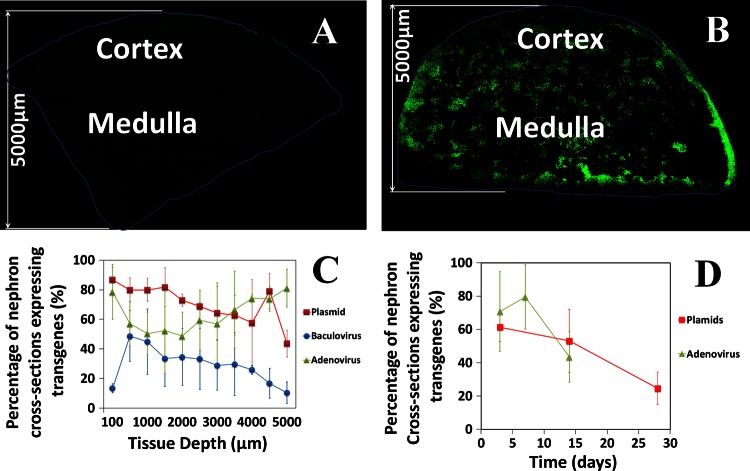
Fig. 7.
Quantitative analysis of fluorescent protein expression following hydrodynamic delivery. A and B: montages collected from fixed kidneys 3 days following injection of saline (A) or EGFP-tubulin (B). C: expression of EGFP-tubulin from plasmid vectors and expression of EGFP-actin from baculovirus or adenoviral vectors at the indicated distances from the cortical surface of the kidney 3 days after injection. D: expression of EGFP-actin from plasmid or adenoviral vectors estimated from intravital fields at the indicated times following injection.

