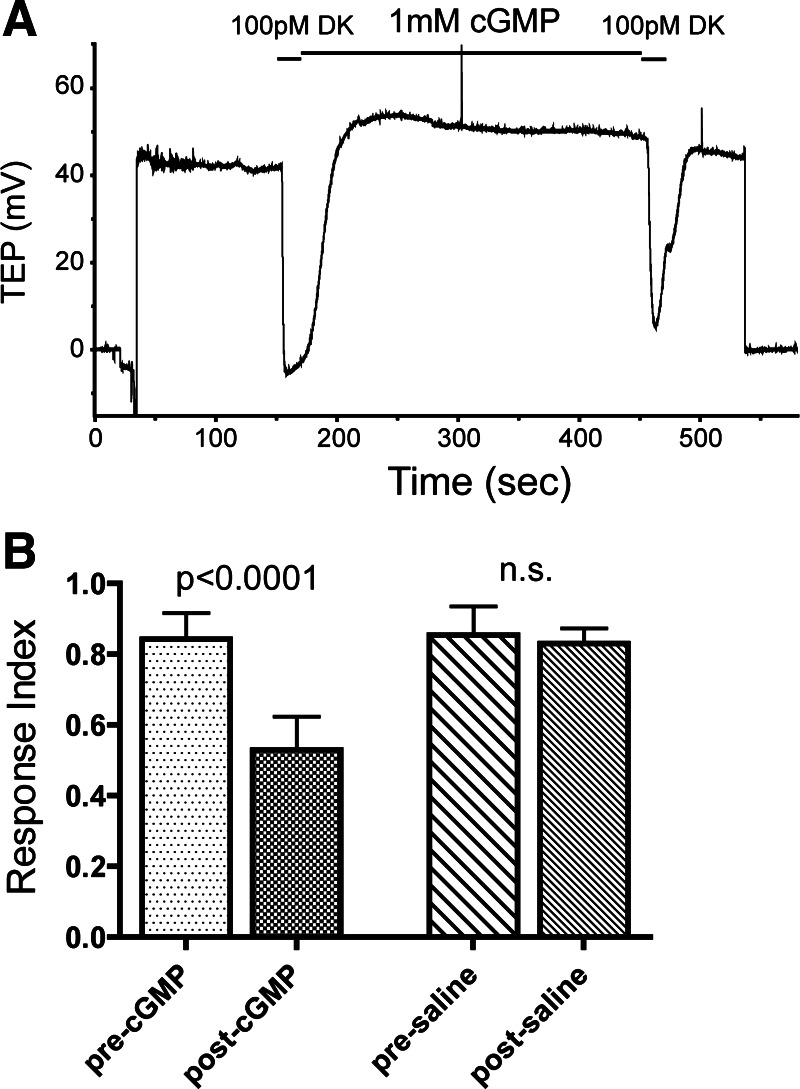
Fig. 3.
Modulation of drosokinin (DK) responses by cGMP. A: TEP recording of a MT bathed in saline and treated with 2 20-s applications of 100 pM DK separated by treatment with 1 mM cGMP. B: mean responses to 100 pM DK before and after treatment with either 1 mM cGMP (left bars) or saline (right bars). P values indicate comparisons between the 2 responses by paired t-test; n = 8 tubules per condition. Error bars indicate SD.

