Fig. 4.
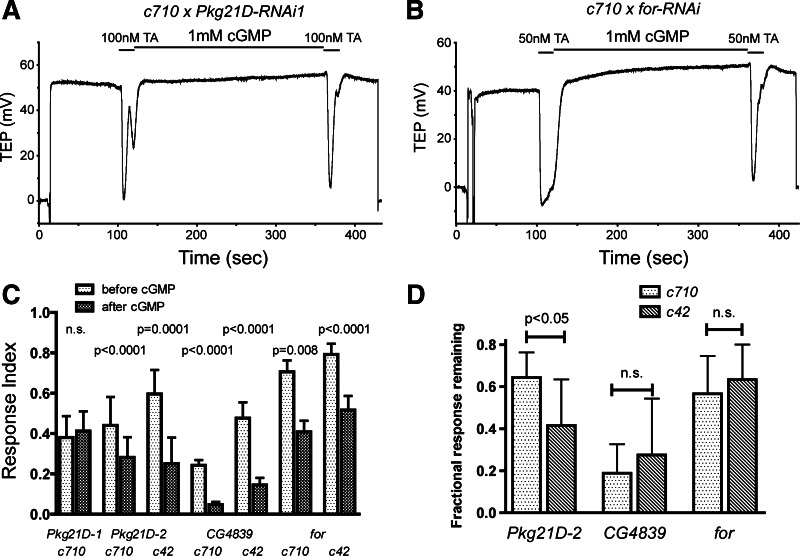
Role of specific PKG isoforms in the modulation of the TA response. A and B: TEP recordings of MTs dissected from progeny of w; UAS-Dcr-2 c710-gal4 × w; Pkg21D-RNAi1 (A) or w; for-RNAi/CyO (B). MTs were bathed in saline and treated with 2 20-s applications of 100 nM (A) or 50 nM (B) TA separated by 1 mM cGMP. C: mean TA responses before and after treatment with 1 mM cGMP for progeny of crosses between either w; UAS-Dcr-2 c42-gal4 or w; UAS-Dcr-2 c710-gal4 and the 4 RNAi lines. TA was applied at 50 nM except for progeny of w; UAS-Dcr-2 c710-gal4 × w; Pkg21D-RNAi1, which were treated with 100 nM TA to obtain responses of similar amplitude to the other genotypes; n = 8–10 MTs per condition. P values result from comparisons of the first and second responses by paired t-test or Wilcoxon signed rank test. D: data from C are replotted to show the fraction of the initial TA response remaining after treatment with cGMP for the progeny of the 6 crosses that responded to cGMP. For each RNAi line, the responses of c42 and c710 progeny were compared by 1-way ANOVA and Bonferroni posttest. Error bars indicate SD.

