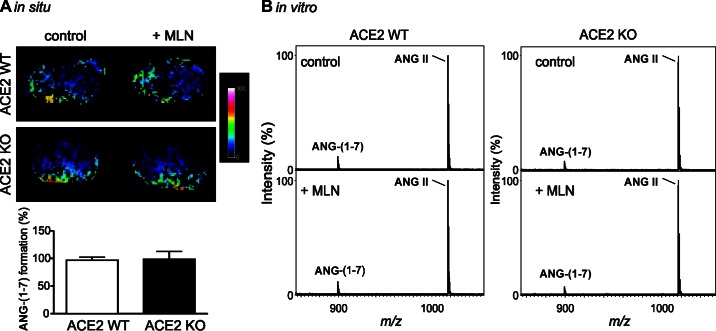
Fig. 4.
Effect of the ACE2 inhibitor MLN-4760 on renal ANG-(1–7) formation in ACE2 WT and ACE2 KO mice at pH 5. A: imaging MS of kidney sections incubated with 1 mM ANG II for 15 min without (control) or with 80 μM MLN-4760 (+MLN). Values are means ± SE of 4 mice per group. On 2-way ANOVA, there were no differences among the groups. B: kidney homogenate (50 μg) was incubated for 30 min in 50 mM citrate buffer (pH 5) containing 0.02 mM ANG II without (control) or with 80 μM MLN-4760 (+MLN), and generated ANG-(1–7) was evaluated using MS. m/z, Mass-to-charge ratio.

