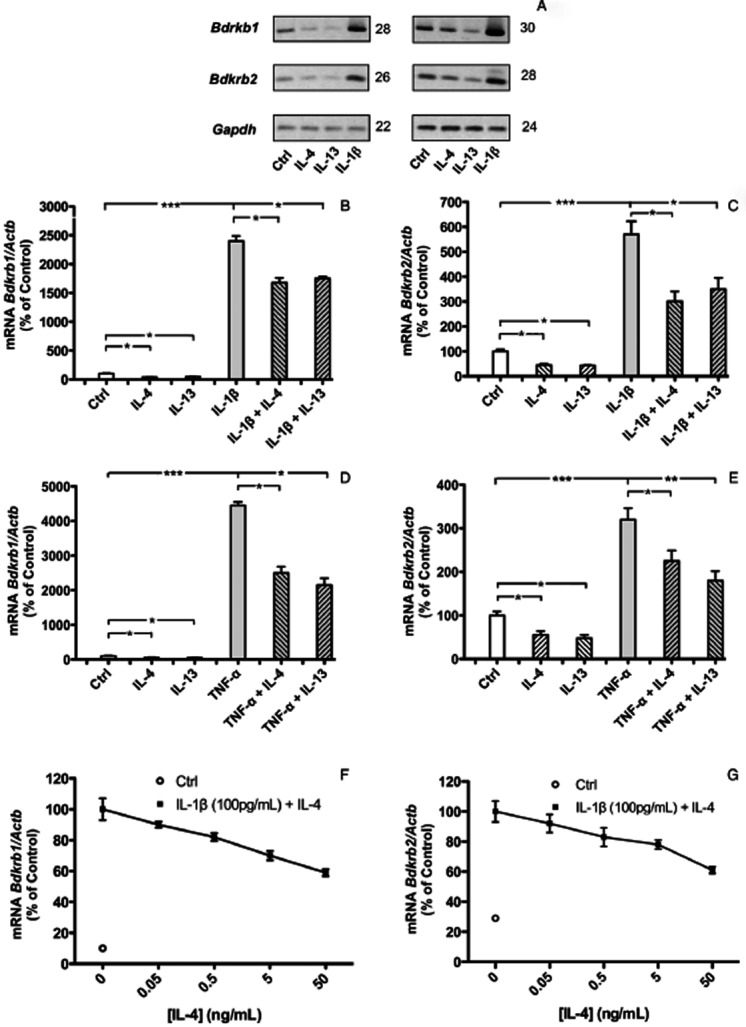
Figure 1.

Semi-quantitative (A) and quantitative RT-PCR analyses (B–G) of the mRNA expressions of BDKRB1 (A, B, D, F) and BDKRB2 (A, C, E, G), in MG-63 cells. Effects of IL-4 (30 ng·mL−1), IL-13 (30 ng·mL−1) and IL-1β (100 pg·mL−1), on the mRNA expressions of BDKRB1 and BDKRB2 (A). Quantitative RT-PCR analyses of the effects of IL-4 (50 ng·mL−1), IL-13 (50 ng·mL−1), IL-1β (100 pg·mL−1), TNF-α (10 ng·mL−1) and the combination of IL-1β with either IL-4 or IL-13 (B, C) or TNF-α with either IL-4 or IL-13 (D,E) on the mRNA expressions of BDKRB1 and BDKRB2. IL-1β stimulated mRNA expressions of both BDKRB1 and BDKRB2 were inhibited by IL-4 in a concentration-dependent manner (F, G). The values represent means ± SEM for four wells per group. SEM is shown as vertical bars when larger than the radius of the symbol. In quantitative RT-PCR reactions, samples were analysed in duplicates and normalized with RPL13A. In B, C, D and E, the statistically significant effects are shown by asterisks (*, P < 0.05; **, P < 0.01; ***, P < 0.001). In F and G, statistically significant (P < 0.05) effects were obtained at 0.5–50 ng·mL−1 IL-4. Figures to the right of the gels in (A) denotes the number of cycles used in the PCR reactions.
