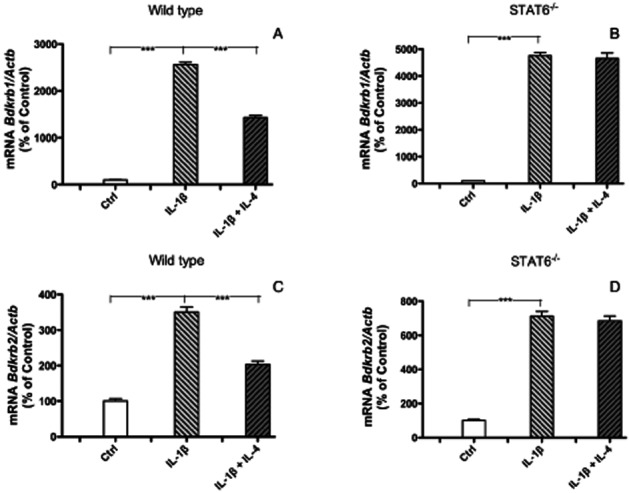
Figure 6.

Quantitative RT-PCR analyses of the mRNA expressions of Bdkrb1 (A, B), Bdkrb2 (C, D), in calvarial bones from wild type mice (A, C) or Stat6-deficient mice (B, D). Bones were incubated for 24 h without (control) or with IL-1β (100 pg·mL−1) in the absence or presence of IL-4 (50 ng·mL−1). The values represent means ± SEM for 5–6 bones per group. The statistically significant effects are shown by asterisks (***P < 0.001).
