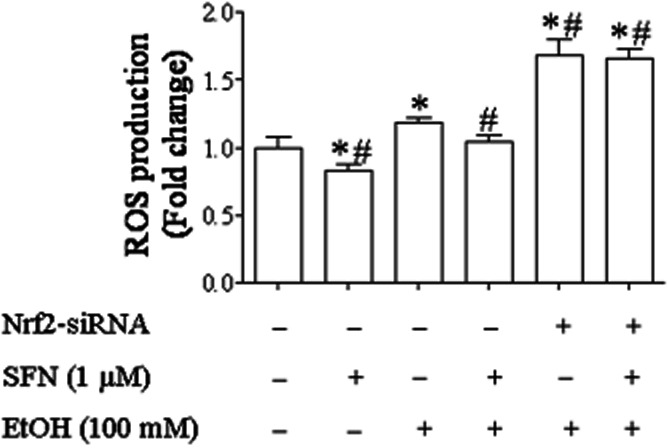
Figure 7.

ROS generation in ethanol-exposed NCCs treated with SFN or transfected with Nrf2- siRNA. NCCs transfected with control or Nrf2-siRNA were treated with 100 mM ethanol or 1 μM SFN alone or in combination. ROS generation was determined as described in the Methods section. Data are expressed as fold change over control and represent the mean ± SEM of three separate experiments. *P < 0.05 versus control. #P < 0.05 versus EtOH.
