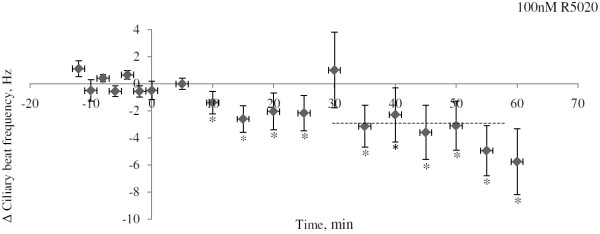
Figure 6.

Change in ciliary beat frequency (CBF) over time after exposure to 100 nM R5020. A baseline frequency was established then R5020 was added and the CBF measured every 5 minutes during 60 minutes. The drug was added at time point zero and the mean change in CBF after 30 minutes are shown as a crosshatched line. The CBF values were first normalized against its baseline frequency then for each mouse the exposed cell were compared to the control cell at each time point. Then the average change in CBF at all time points was calculated and expressed as mean ± SEM. The time points where the change in CBF is significantly different from zero is shown as * P < 0.05.
