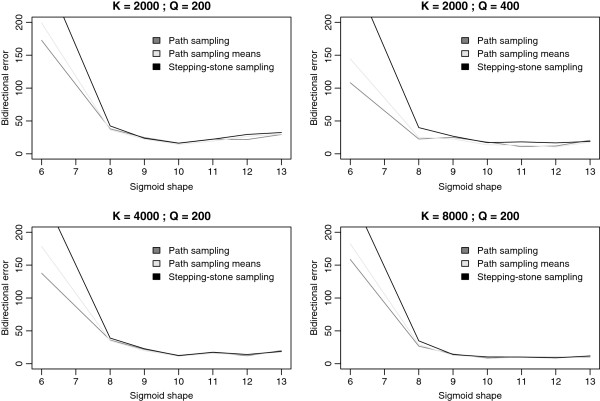
Figure 3.
Comparison of annealing and melting estimates with increasing computational settings. Laurasiatheria data set: visual comparison of the bidirectional mean log Bayes factor, estimated using stepping-stone sampling, for each sigmoid shape value with the corresponding intervals composed of both annealing and melting estimates. In general, these intervals decrease in width with increasing computational settings.

