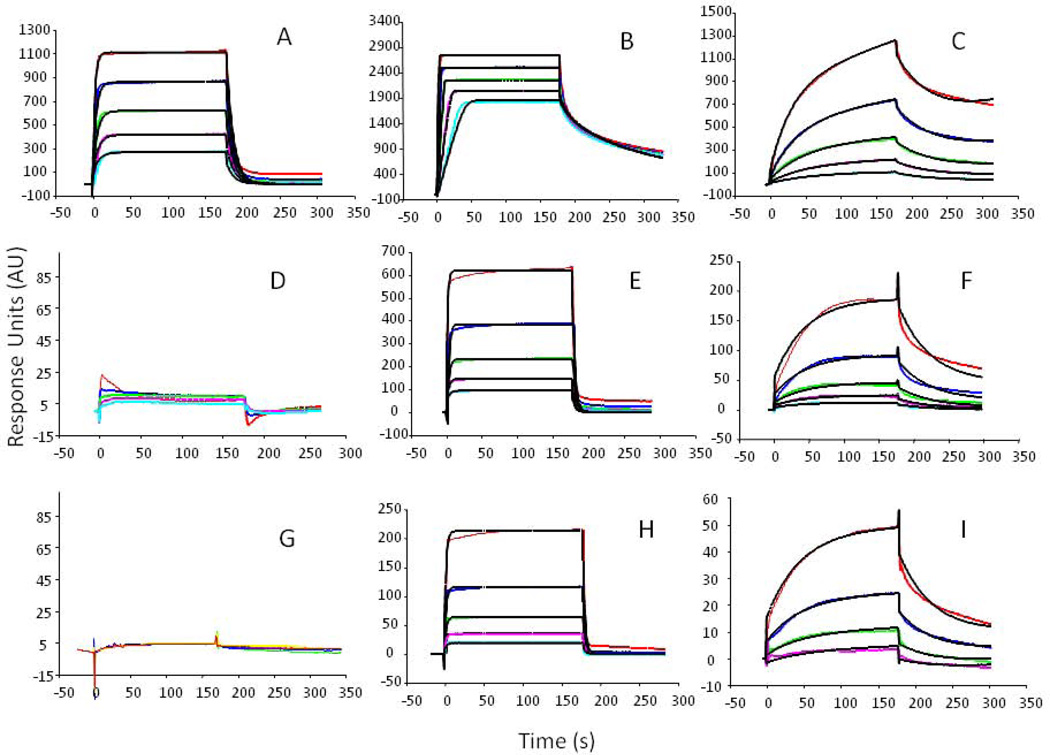
Figure 5.
SPR binding curves of KS and HS with SHH, FGF2 and FGF1 proteins. Top row: commercial HS bound to: A. FGF1; B. FGF2; C. SHH; middle row: commercial KS bound to: D. FGF1; E. FGF2; F. SHH; bottom row: isolated KS bound to: G. FGF1; H. FGF2; I. SHH. Concentrations of each protein used are delineated by line color, red, 1000 nM; navy, 500 nM; green, 250 nM, pink, 125 nM; light blue 63 nM.

