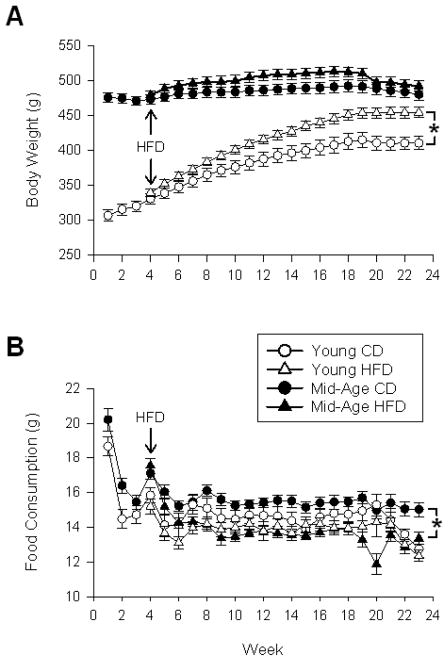
Figure 1. Body weight and food consumption across 23 weeks of HFD.
A shows mean body weights across weeks of treatment. B shows amounts of food consumed (averaged on a weekly basis). Data analysis includes the period from 4–23 weeks during which the HFD was in effect. Mean ± SEM are shown. Asterisks indicate significant difference @ p < 0.05 level.

