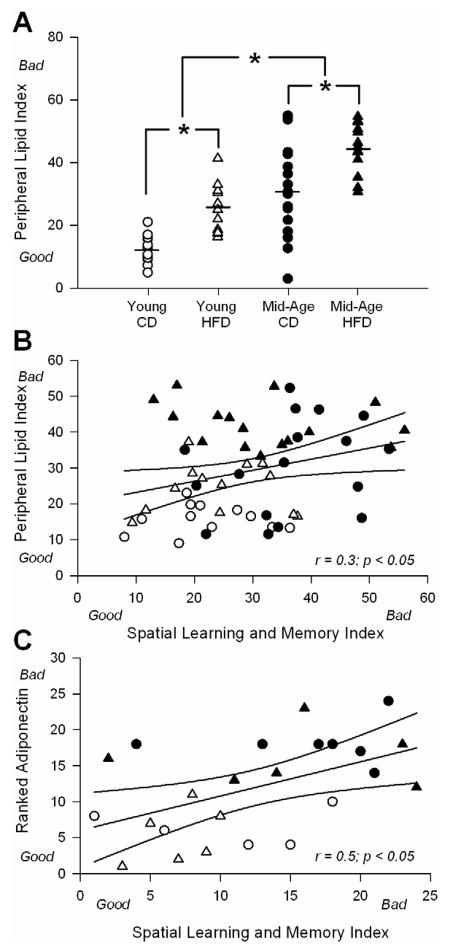
Figure 3. Correlations across peripheral lipid index (PLI), spatial learning and memory index (SLMI), and adiponectin levels.
A for each animal, an index was created from cholesterol levels, HDL: LDL, and retroperitoneal fat weight (higher number is associated with greater dyslipidemia). Lower (better) scores on the PLI are seen in younger animals on control diet (CD). Main effects of both diet and age were seen and clearly separate the animal groups. Asterisks represent significant differences between treatment groups @ p < 0.05 level. B shows the correlation between the PLI and the SLMI for all animals in the study. Ninety-five percent confidence intervals are shown along with trendline and results of the analysis. C shows a similar analysis between ranked adiponectin staining levels and the SLMI for twenty-four animals from which both data sets were available. Ninety-five percent confidence intervals are shown along with trendline and results of the analysis.

