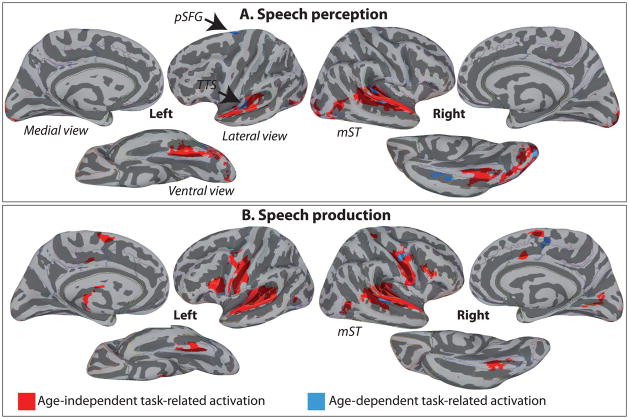
Figure 2.
Regions significantly active, at the group-level, corrected for multiple comparisons, A. for the conjunction of Perception Young and Perception Older (top row – in red), and B. for the conjunction of Production young and Production Older (bottom row – in red), shown on lateral, medial and ventral views of the cerebral hemispheres. Red-coloured activation represents the age-independent task-related activation, while blue-coloured activation represent age-dependent activation in speech perception and speech production. Activations are shown on the group average smoothed white matter inflated surface.

