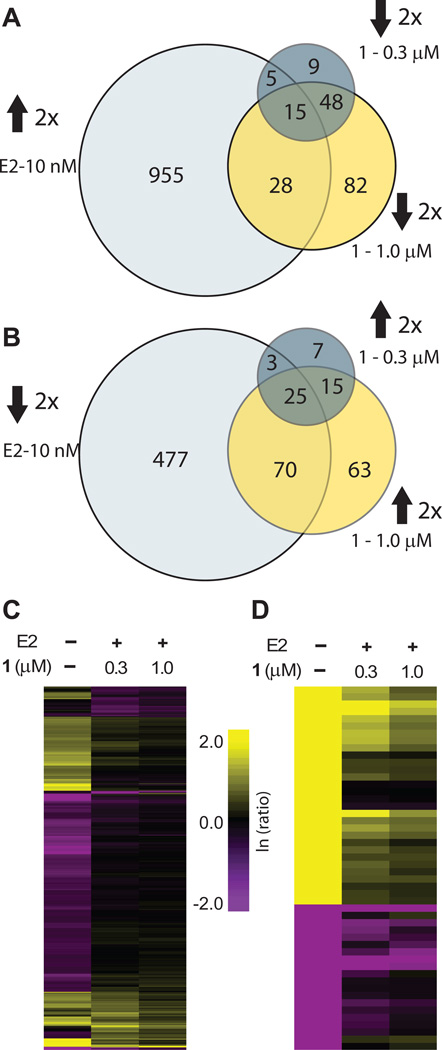
Figure 3.
RNA-seq global transcriptome analysis. All ratios are normalized to the induced control (10 nM E2). A, Venn diagrams show the overlap between genes upregulated by E2 at least two-fold and genes downregulated by 1 at 0.3 µM or 1.0 µM. B, Venn diagrams for the overlap of genes downregulated by E2 at least two-fold and de-repressed by 1 at 0.3 µM or 1.0 µM. C, Hierarchical clustering (Euclidian distance, complete linkage) of genes changed at least two-fold as compared to the induced state. D, 50 genes that were most changed by E2 induction were clustered (Eucludian distance, complete linkage). Of those genes 30 were upregulated and 20 were downregulated by E2. Fold-changes are relative to E2-induced control.

