Figure 5.
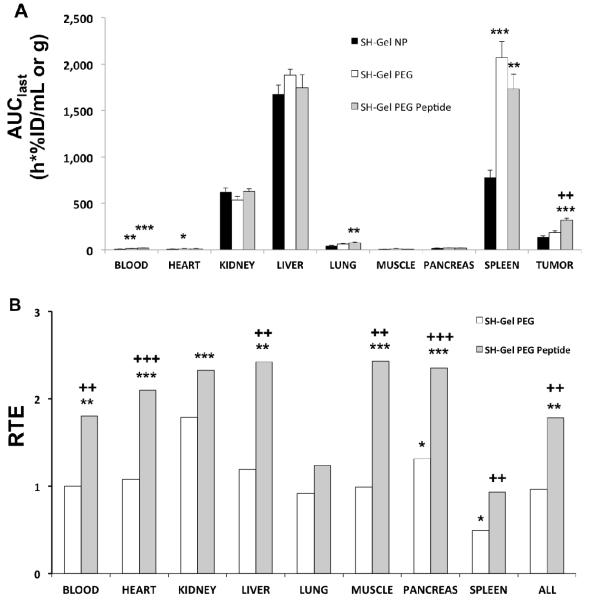
Biodistribution in the organs and targeting efficiency. (A) Exposure of the main organs as evaluated by area under the concentration versus time curve from 0 to 24h (AUClast) + standard error. (B) Relative targeting efficiency (RTE) of poly(ethylene glycol)-modified (SH-Gel PEG) and EGFR targeted thiolated gelatin nanoparticles (SH-Gel PEG Peptide) versus thiolated gelatin nanoparticles (SH-Gel NP). A value of 1 means similarity to SH-Gel NP targeting efficiency (TE). AUClast and TE were compared between nanoparticle types using an unpaired t-test: * p < 0.05, ** p < 0.01, and *** p < 0.001 for comparison to SH-Gel NP; + p < 0.05, ++ p < 0.01, +++ p < 0.001 for comparison to SH-Gel PEG.

