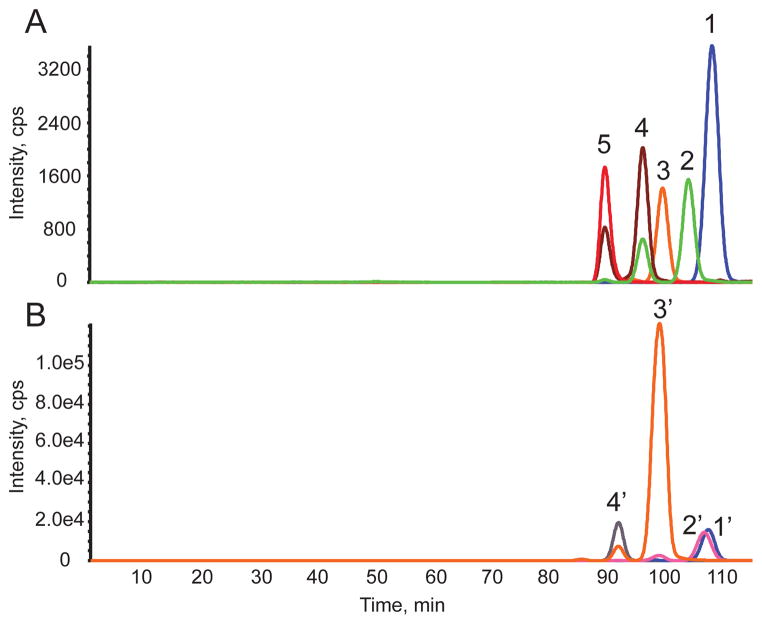
Figure 1.
Representative extracted ion chromatograms (EICs) for HS and CS disaccharides and monosaccharide for human leukocytes observed using SEC-MS. (A) Δ4,5- unsaturated HS disaccharides from T cells from Donor 2. 1, D0A0; 2, D0S0; 3, D0A6/D2A0; 4, D0S6/D2S0; 5, D2S6. D2A6 is not shown here because it was very low in abundance. Note that traces 2 and 4 were observed as two peaks due to in-source losses of SO3. These losses were corrected for in the quantitative calculations. (B) 4,5-unsaturated CS disaccharides and monosaccharide from PMNs from Donor 2. 1′, D0a0; 2′, GalNAcSO3; 3′, D0a4/D0a6; 4′, D0a10/D2a6/D2a4. Note that trace 3′ is observed as two peaks due to in-source loss of SO3. These losses were corrected for in the quantitative calculations. Trace 2′ was also observed as two peaks due to in-source fragmentation of D0A6/D2A0.

